Basic Survey Stats:
Ó 2003, Right Brain, Ink.
First, find your split half reliability to see how good your survey is. If your survey “hangs together” then if someone scores high on one half that person should score high on the second half; likewise, if someone scores low on the first half that person should score low on the second half if there is internal consistency within your survey. So, go to STATISTICA and open your database, as the example below:
Then, go under Statistics, Descriptive Stats and Tables and click on Correlation Matrix:


This following will emerge – put your even score on one side, and your odd score on the other:

Click on All Results and Matrix Then, click OK

![]()
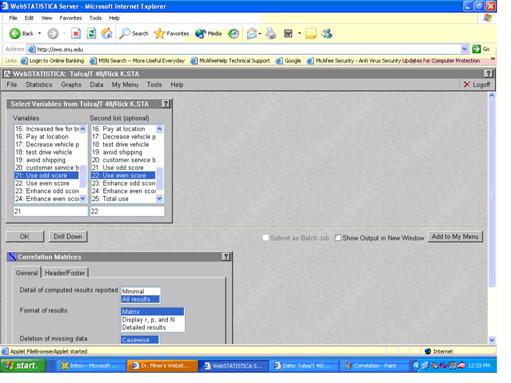
You will then see the Pearson correlation between the odd and even scores. This is your r½ ½. Next, you will use the Spearman Brown Prophesy Formula to correct the half, half correlation for the whole survey. That figure will be your final correlation for your survey, or rtt. Read more about this in the handout, “Split Half Write up.”