Saving graphs and tables in STATISTICA:
Ó 2003, Right Brain, Ink.
In order to save a table in STATISTICA, it is assumed that you have at least Office 2000 on your system. I don’t think this process works for earlier versions.
 First,
highlight everything that you want from the table in STATISTICA. The highlighted text will turn blue.
First,
highlight everything that you want from the table in STATISTICA. The highlighted text will turn blue.
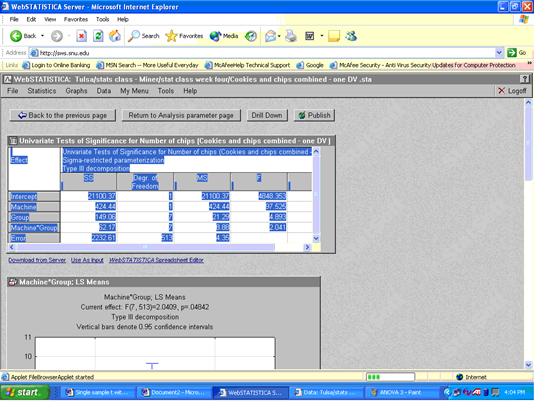
Next, open a Word document and paste in the table (go under Edit). If there’s a long title here, then the table will come out funny, like this.

|
|
||||||||||||||||||||||||
|
|
|
|
|
|
||||||||||||||||||||
|
21100.37 |
1 |
21100.37 |
4848.353 |
0.000000 |
|
|||||||||||||||||||
|
424.44 |
1 |
424.44 |
97.525 |
0.000000 |
|
|||||||||||||||||||
|
149.06 |
7 |
21.29 |
4.893 |
0.000023 |
|
|||||||||||||||||||
|
62.17 |
7 |
8.88 |
2.041 |
0.048419 |
|
|||||||||||||||||||
|
2232.61 |
513 |
4.35 |
|
|
|
|||||||||||||||||||
So, edit out that long title and the table will get smaller, like this.
|
|
||||||||||||||||||||||||
|
|
|
|
|
|
||||||||||||||||||||
|
21100.37 |
1 |
21100.37 |
4848.353 |
0.000000 |
|
|||||||||||||||||||
|
424.44 |
1 |
424.44 |
97.525 |
0.000000 |
|
|||||||||||||||||||
|
149.06 |
7 |
21.29 |
4.893 |
0.000023 |
|
|||||||||||||||||||
|
62.17 |
7 |
8.88 |
2.041 |
0.048419 |
|
|||||||||||||||||||
|
2232.61 |
513 |
4.35 |
|
|
|
|||||||||||||||||||
You might try this with Word 6 – 95, but I just don’t know if it will work. If not, you are doomed to type the table by hand.
One other hint to use in case the Word document won’t format correctly, is to paste the table into and Excel spreadsheet and then copy that into Word.