Everybody knows that when it comes to climate and weather, there really is no difference between Oklahoma and Hawaii. What?!?!?! You mean you don't believe me? Well, let's look at the statistics (after all, this is a stat course). The average (mean) daily temperature in Hawaii is 78 degrees farenheit. The average daily temperature in Oklahoma is 77 degrees farenheit. You see...no difference.
You still don't buy it huh? Well you are indeed smarter than you look. But how about those numbers? Are they wrong? Nope, the numbers are fine. But what we learn here is that our measures of central tendency (mean, median and mode) are not always enough to give us a complete picture of a distribution. We need more information to distinguish the difference.
Well before we go any further, let me ask a question: Which average temperature more accurately describes that state? Is 78 degrees more accurate of Hawaii than 77 degrees is of Oklahoma? Well if you live in Oklahoma I suspect you decided that 77 degrees is a fairly meaningless number when it comes to describing the climate here.
Let's look at some numbers. Below is a table with average daily temperatures for Hawaii and Oklahoma. For each state we randomly selected 17 days out of the year.
Hawaii
72
75
76
77
77
78
78
78
78
78
78
78
79
79
80
81
84
Oklahoma
56
61
66
69
74
76
76
77
77
77
78
78
80
85
88
93
98
Write down these numbers and let's go to another website where we can calculate some descriptive statistics. Once you are at the new site, enter the temperatures for Hawaii and then select Standard Deviation and click "Do it". Record the mean and standard deviation and then use your back button to enter the data for Oklahoma. Again select Standard Deviation and click "Do it". Record that mean and standard deviation and then use the back button twice to return here. Click here to go to the calculator.
Okay...so the mean temperatures were 78 for Hawaii and 77 for Oklahoma...right? But notice the difference in standard deviation. Hawaii is a mere 2.52 while Oklahoma came in at 10.57. What does this mean you ask? Well the standard deviation tells us the standard amount that the distribution deviates from the average. The higher the standard deviation, the more varied that distribution is. And the more varied a distribution, the less meaningful the mean. You see in Oklahoma, the standard deviation for temperature is higher. This means that our temperatures are much more varied. And because the temperature varies so much, the average of 77 doesn't really mean much. But look at Hawaii. There the standard deviation is very low. This of course means the temperature there does not vary much. And as a result the average of 78 degrees is much more descriptive of the Hawaiin climate. I wonder if that has anything to do with why people want to vacation in Hawaii rather than Oklahoma?
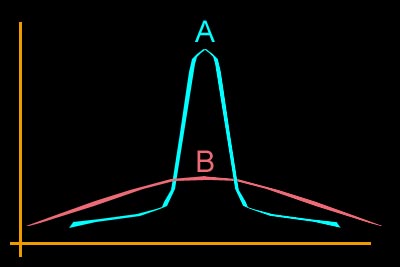
Let's look at this another way. The following is a graph with the frequency polygons for both Hawaii temperatures and Oklahoma temperatures. Which of the polygons represents Hawaii and which represents Oklahoma?
Polygon A represents Hawaii and B represents Oklahoma. Notice how the Hawaii temperatures are bunched up in the middle. This is indicative of a homogenous distribution. Oklahoma's polygon is flat. This indicates that the temperatures are spread out and not very homogenous.
Variability is a very important concept in the study of statistics. With our measures of variability (Range, Standard Deviation, and Variance) we can determine just how meaningful our mean is.