
School of Adult Studies
Data Analysis Methods
Some Statistical Calculations Using the SHARP EL-520WB
In the first statistics course I took, calculators were frowned upon. A great deal was made about showing our work as evidence that we could perform the calculations by hand. My own bias is that few situations exist in the world where someone might be asked to perform these calculations by hand due to the abundance of cheap technology to fill the bill. So let's learn to tame this little beast we call the SHARP EL-520WB calculator.
SETTING STATISTICAL MODE
The first thing we need to do is put the calculator into statistical mode. Follow these three steps to change the calculator's mode:
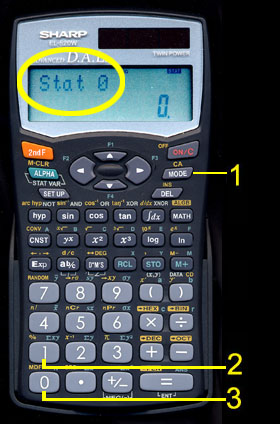
- 1. Press the [ MODE ] key.
- 2. Press the [ 1 ] key for STAT.
- 3. Press the [ 0 ] key for SD.
Note that when placed in statistical mode, the upper display now reads "stat 0". This indicates that we are in single-variable statistical mode. The calculator actually is capable of other statistical modes which we will cover in another lesson.
Note that all calculations for this course can be done in statistical mode. Once you place the calculator in this mode, it will remain so until the mode is changed. This is true even after the calculator is turned off and back on.
ENTERING DATA
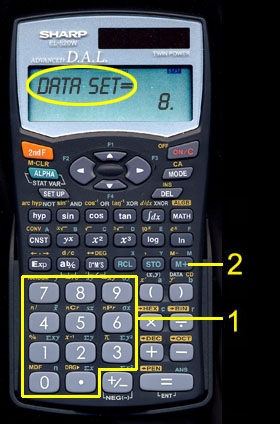
The next thing we need to do is to input our data (each observation). As an example, I'm using homework problem one at the back of Chapter 3 in your textbook. We will use the eight observations in the problem and calculate the MEAN, POPULATION STANDARD DEVIATION, and SAMPLE STANDARD DEVIATION. To input the data, for each observation, do the following:
- 1. Press in the observation using the numeric keys.
- 2. Press the [M+] key. (Note the word DATA in white below this key)
Our sequence of keystrokes would be: [ 1 ] [ 2 ], [M+], [ 1 ] [ 1 ], [M+], [ 1 ] [ 0 ], [M+], [ 2 ] [ 0 ], [M+], [ 1 ], [M+], [ 9 ], [M+], [ 1 ] [ 0 ], [M+], [ 1 ] [ 0 ], [M+].
Note that the upper display reads "DATA SET=" while the main display reads "8". As you would guess this means that 8 observations have been entered or you have an N of 8 observations.

CALCULATING A MEAN
Once our data is entered, it is very simple to obtain a variety of statistical information. Statistical functions appear as pale green writing above the keys. To perform any of those functions we begin by pressing the [RCL] key followed by the appropriate function key. To calculate the mean, follow these 2 steps:
- 1. Press the [RCL] key.
- 2. Press the [ 4 ] key. (note the green x-bar above the key)
Note that the upper display now reads "x-bar =" while the main display reads "10.375". While our text uses M to indicate mean, the more common symbol used is x-bar (an X with a bar on top of it). The display is of course telling you that the mean is 10.375.

CALCULATING THE POPULATION STANDARD DEVIATION
The data that we entered originally remains in the memory of the calculator until a "Clear All" function is performed ( [2nd F], [DEL] ). For this reason we don't have to be concerned with inputing the data every time we want to perform a different statistical calculation. So at this point, to find the population standard deviation, simply follow these 2 steps:
- 1. Press the [RCL] key.
- 2. Press the [ 6 ] key. (note the green little sigma sub x above the key)
Note that the upper display now reads "o x =" while the main display reads "4.820504871". The "o" is actually the greek letter little sigma which is used to denote population standard deviation. The display is of course telling you that the standard deviation is 4.82.
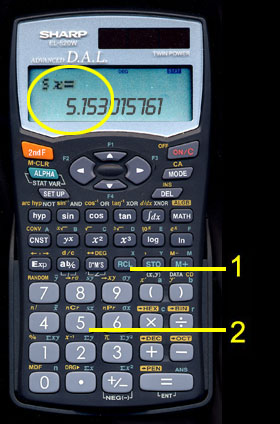
CALCULATING THE SAMPLE STANDARD DEVIATION
The sample standard deviation is found by following these 2 steps:
- 1. Press the [RCL] key.
- 2. Press the [ 5 ] key. (note the green s sub x above the key)
Note that the upper display now reads "s x =" while the main display reads "5.153015761". The "s" is used to denote sample standard deviation. The display is of course telling you that the standard deviation is 5.15.